Data Interpretation
How signals become meaning before they become decisions.
Data does not explain itself. Signals may reveal movement, change, friction, or response, but they still require context to be understood. This lens examines how information is interpreted and how meaning shapes the decisions that follow.
What Data Interpretation Examines
Data interpretation examines what happens after information has been collected.
It looks at how signals are read, what meaning is assigned to them, and what context is needed before a number can support a decision.
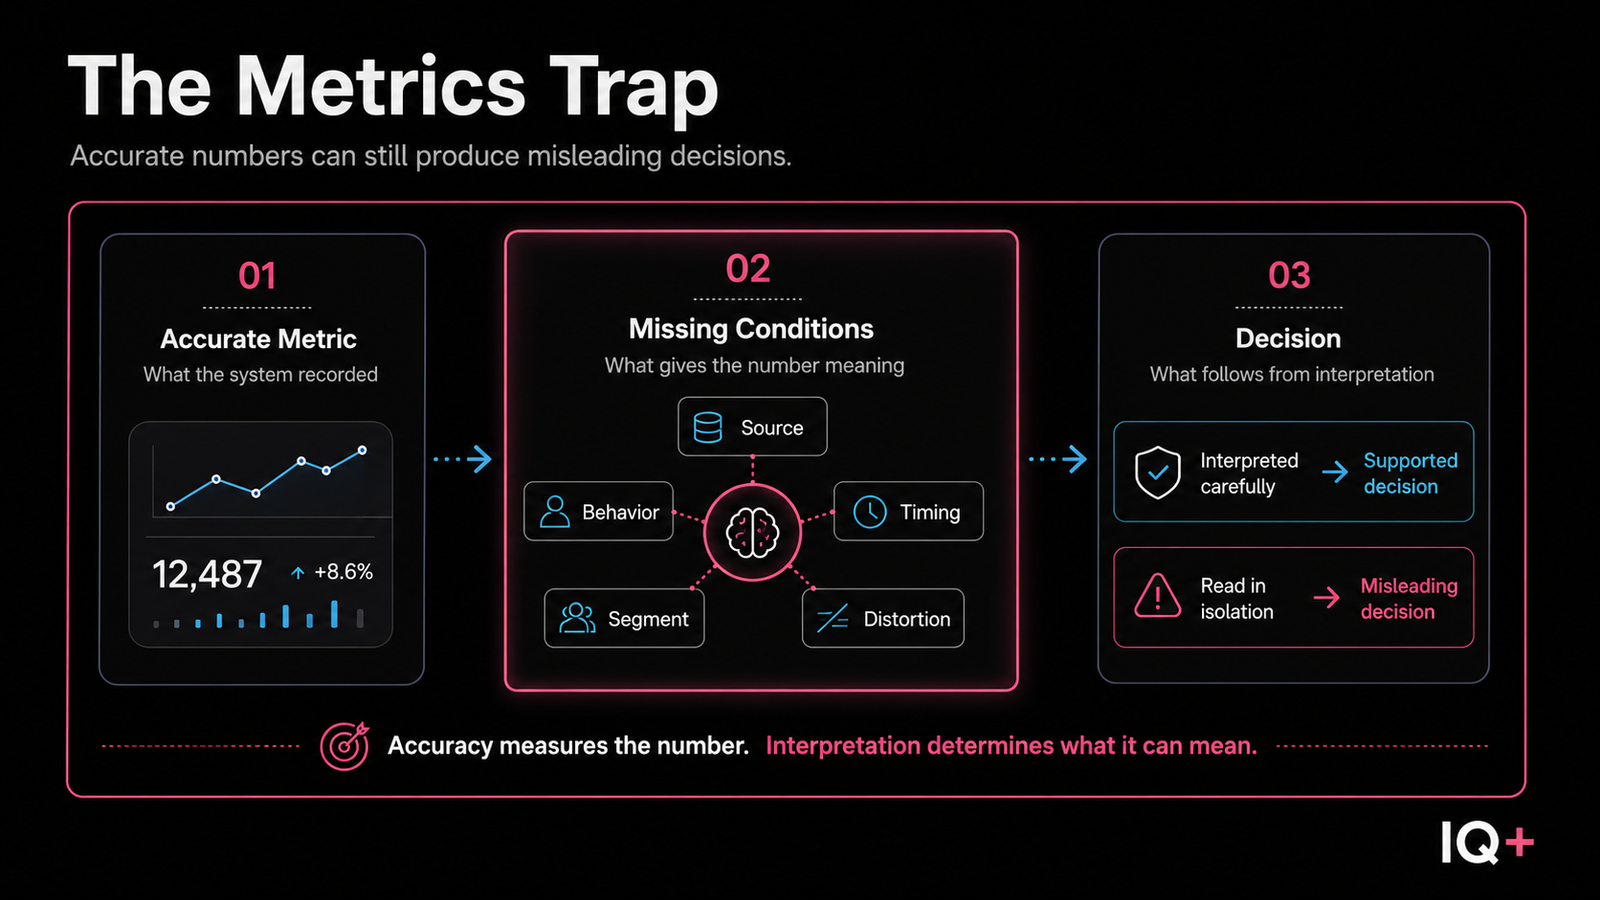
A metric may show that something changed, but it does not automatically explain why it changed, whether the change matters, or what should happen next.
This lens concerns the space between measurement and judgment.
The purpose is not to collect more data.
The purpose is to understand what the available data can reasonably support.
Statistics Canada’s guidance on data quality reinforces this distinction. It explains that users need enough information about methodology, assumptions, limitations, and accuracy to judge whether data is suitable for its intended use or interpretation.
Through this lens, data interpretation becomes the process through which signals become evidence, meaning, and decisions.
What Data Interpretation Helps Identify
Data interpretation helps show where confidence may be built on a weak understanding.
A business may have reports, dashboards, and performance metrics, but still misunderstand what the data is actually saying. The issue is not always the data itself. It is often the assumptions placed on top of it.
This lens helps identify where:
- Metrics are being treated as explanations
- Reporting is being mistaken for understanding
- Context is missing from the performance analysis
- Numbers are used to confirm existing beliefs
- Decisions are made before the signal has been properly interpreted
The value of this lens is in slowing down the move from data to conclusion.
It helps separate what is measured from what can actually be known.
Where Data Interpretation Fits
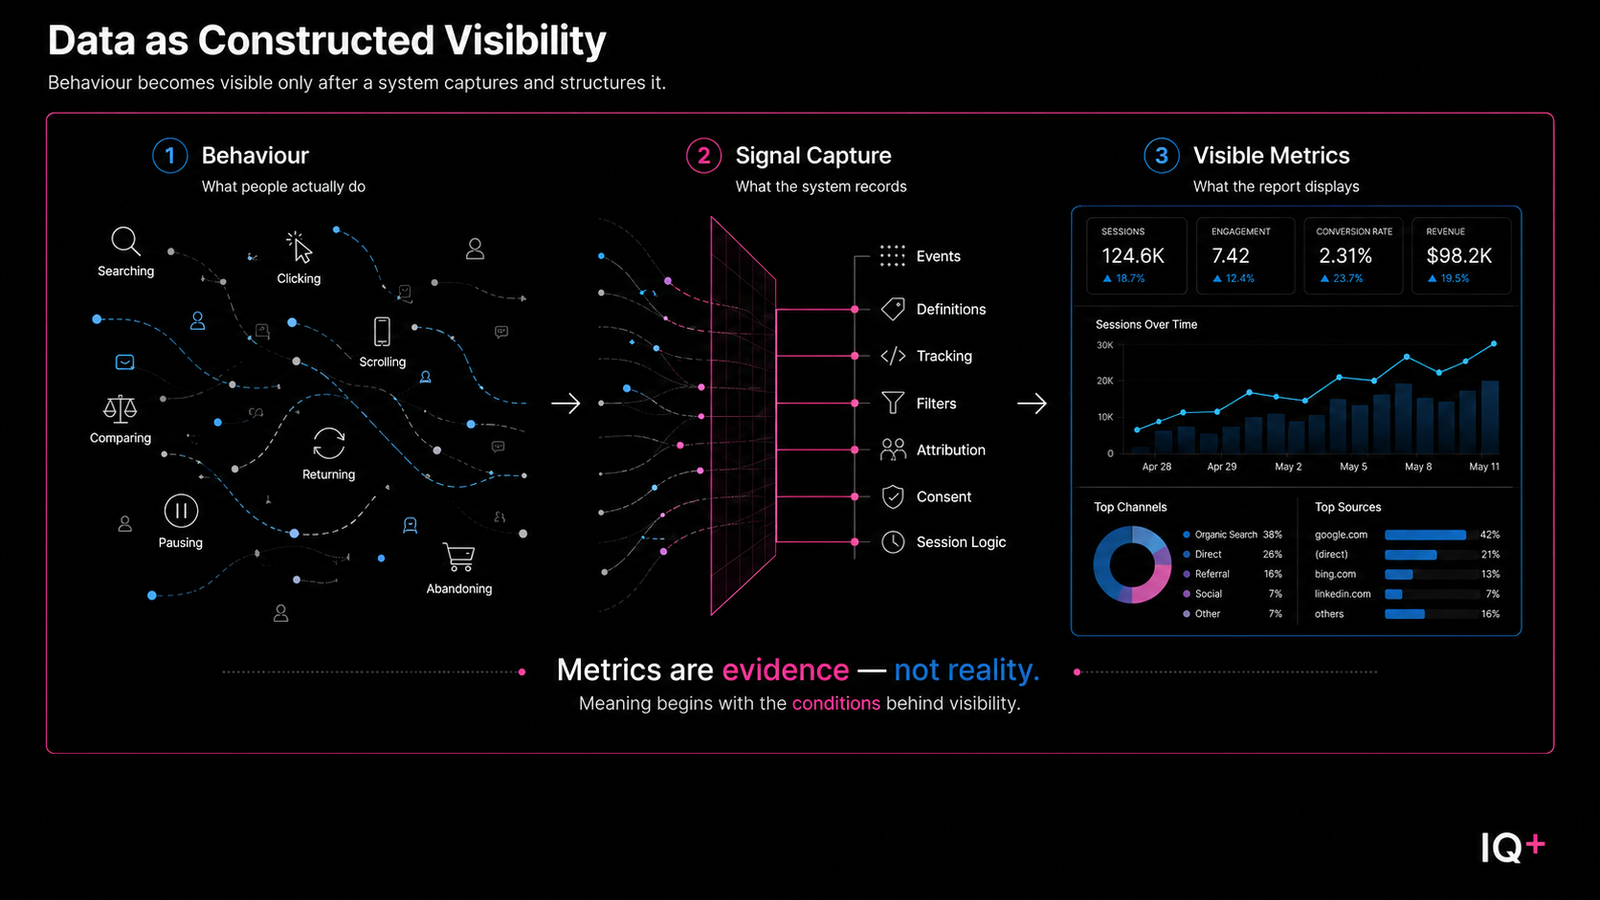
Data interpretation sits between signal and decision.
After behaviour produces data, that data has to be read before it can guide a response. This is the point where meaning is assigned, assumptions enter, and direction begins to form.
Within AnalytIQs+, this lens helps examine the middle of the decision process.
It shows how raw signals become interpreted information, and how that interpretation shapes the choices that follow.
When this stage is weak, the rest of the system can move with confidence but without enough clarity.
Core Questions Behind This Lens
Data Interpretation is built around a simple concern:
What does data actually mean once it has been collected?
From there, the lens explores questions such as:
- What context is needed before a signal can be understood?
- Where does reporting stop and interpretation begin?
- When does a metric clarify performance, and when does it distort it?
- What assumptions are being placed on the data?
- How does interpretation shape the next decision?
These questions help keep the analysis grounded.
They move the focus away from collecting more information and toward understanding what the available signals can actually support.
What You Will Find Here
This lens examines the point at which data becomes meaning in digital decision-making.
The writing looks at how numbers are read, how context shapes interpretation, and how weak assumptions can turn useful data into misleading directions.
It does not focus on dashboards, reporting templates, or metric tracking for its own sake.
It focuses on interpretation.
The purpose is to read data more carefully so that decisions are based on clearer signals, stronger context, and more responsible conclusions.
Related Analysis
Data Interpretation is one application of the broader AnalytIQs+ framework. It builds on Search Behavior by examining how behavioral signals become structured visibility for analysis. It also connects with Content Systems, where interpretation shapes how information is organized, published, and recalibrated over time. For a deeper treatment of this lens, read Data as Constructed Visibility and The Metrics Trap: How Accurate Numbers Can Still Mislead You.
Stay Connected
Receive new AnalytIQs+ essays and publication updates directly by email.