
What IKEA’s Search Evaluation Reveals About Behavioural Representation
In 2026, IKEA researchers reported a search result that looked straightforward at first. On a 100-query real-world benchmark, a model trained with hard-negative mining (HNM), a method that adds semantically difficult wrong examples to force finer distinctions, improved Category Accuracy@10 from 73.4 to 76.0. The same configuration then moved into a two-week production A/B test. There, the study detected no statistically significant difference in click-through rate, add-to-cart rate, or search-interaction rate.
It is tempting to compress that sequence into a simple story: the offline evaluation improved, but the online test did not. I do not think that is the most useful reading of the case.
The more interesting question is what happened to the behaviour being represented as the evaluation moved from one stage to the next. The study used authentic production queries, real catalogue data, live users, and observed interaction signals. Yet those facts alone do not tell us whether the same population, behavioural proxy, or definition of success travelled intact through the full decision chain.
That is where I think IKEA’s search evaluation becomes analytically useful. The tension is not just between an offline metric and an online metric. It is between several legitimate pieces of evidence that may not all be describing the same slice of user behaviour.
The Search Behaviour IKEA Was Trying to Represent
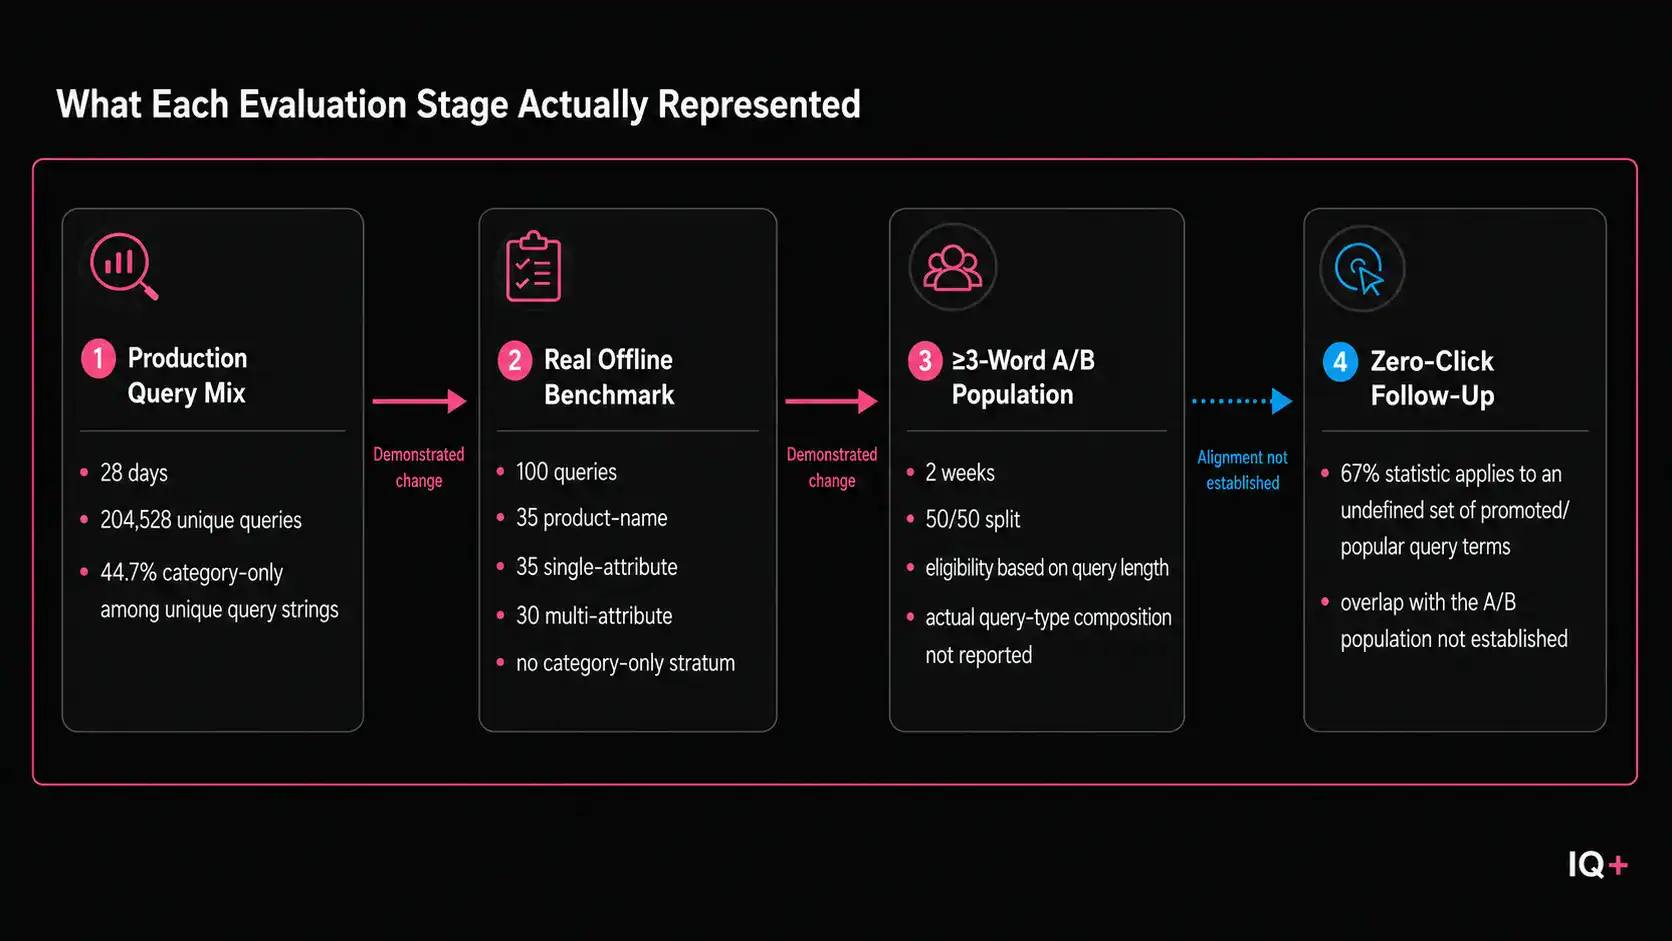
The 2026 study focused on IKEA Canada. The underlying catalogue contained 24,350 products across 373 leaf categories, and the researchers analyzed 204,528 unique production query strings collected over 28 days.
Those queries were not behaviourally uniform. The study classified 18.2% of the unique strings as product-name queries, illustrated with examples such as “billy bookcase”; 12.4% as multi-attribute queries, such as “white wooden desk”; 24.7% as single-attribute queries, such as “large mirror”; and 44.7% as category-only queries, such as “desk,” “bookshelf,” or “curtains.”
That last figure needs to be read carefully. The 44.7% refers to the share of unique query strings in the analyzed set. It does not mean that 44.7% of traffic, sessions, users, or search volume was category-only. The paper does not provide a frequency-weighted distribution.
Even with that limitation, the production log establishes something important: IKEA’s search system had to serve meaningfully different forms of search behaviour. A shopper might search for a product by name, combine several attributes, specify one attribute, or search only at the category level. The search problem was therefore not simply to match text to products. It was to interpret varied expressions of product intent inside a large catalogue.
For me, this is the right place to begin the case. Before asking whether one model performed better than another, I want to know what population of behaviour the evaluation was meant to stand for. The production logs give us the broadest visible picture of that behaviour in the public record.
Why Category Accuracy Became the Decision Signal
The study compared four model configurations using the same dense-retrieval architecture and stated hyperparameters. The main experimental change was the composition of the training data. The baseline used random negatives sampled from the catalogue regardless of semantic similarity, while HNM added harder negative examples intended to make the model distinguish more carefully between products that were semantically close but still wrong.
The offline evaluation did not rely on observed user actions as its definition of relevance. Relevance was constructed through labelled query–product relationships, including LLM-generated and LLM-scored data. The evaluation then used search relevance metrics such as Recall@10, Category Accuracy@10, and Category Accuracy@50.
Recall asks whether relevant products appear among the retrieved results. Category accuracy reflects a different idea of success. It counts a retrieved product as correct when its leaf category belongs to the set of categories drawn from the query’s relevant ground-truth products, even if the exact relevant item is not retrieved.
That distinction matters because IKEA explicitly prioritized category accuracy when deciding which model to move forward. The researchers’ stated hypothesis was that users would prefer seeing products from the correct product type rather than irrelevant product types, even when the exact item they wanted was missed.
I think this is one of the most important decision points in the case. Category accuracy was not merely a technical score that happened to improve. By giving it decision weight, the evaluation encoded a behavioural theory: that being in the right product category should matter to the user in a way that can justify advancing a model.
That theory is plausible. It may even be correct. But the published study did not directly validate that user preference before using category accuracy as a model-selection signal. The behavioural assumption therefore entered the decision chain before live behaviour was measured.
Why HNM Advanced From Offline Evaluation
On the 100-query real benchmark, the HNM configuration produced a mixed offline result. Recall@10 remained unchanged at 41.2. Category Accuracy@10 increased from 73.4 to 76.0, a gain of 2.6 percentage points. Category Accuracy@50 increased from 62.1 to 64.6, a gain of 2.5 percentage points.
The category-accuracy gains were enough for HNM to advance into production testing.
There is an important statistical boundary here. The paper reports means and standard deviations across five training seeds, but it does not report an offline significance test or uncertainty arising from the small evaluation-query samples. I therefore would not describe the 2.6-point Cat@10 gain as statistically established, but I also would not call it statistically non-significant. The study simply does not provide that test.
The construction of the real benchmark also matters. It contained 100 authentic production queries: 35 single-attribute, 35 multi-attribute, and 30 product-name queries. There was no category-only stratum.
At this stage, I do not need to treat that choice as an error. A benchmark can be deliberately constructed to test specific query types. What matters is to keep the construction visible. The evaluation was using real user queries, but “real” and “representative of the broader production mix” are not the same claim.
That distinction becomes more important once the selected model leaves the offline benchmark and enters the live environment.
When the Decision Moved Into Production
IKEA tested the selected HNM model in production for two weeks using a 50/50 traffic split. Eligibility was restricted to long-tail queries defined as queries containing at least three words.
This is the first point where I think the evaluation chain visibly changes shape.
The 100-query real benchmark had been constructed by query type: single-attribute, multi-attribute, and product-name. The production experiment was constructed by query length. Those are different selection rules. A query can belong to one of the benchmark’s semantic classes without necessarily being at least three words long, and a three-word query can cut across the earlier classes.
The paper’s own examples make that concrete. It illustrates product-name queries with strings such as “kallax” and “billy bookcase,” and single-attribute queries with “black shelf” and “large mirror.” Those are one- and two-word queries, below the experiment’s eligibility threshold. Only the multi-attribute examples—”white wooden desk,” “grey velvet sofa”—reach three words. Those examples are illustrative rather than a sample of the benchmark itself, and the paper does not publish the length distribution of the 100 queries. But 65 of those 100 queries were drawn from the two classes the paper chooses to illustrate with short strings.
The public record does not tell us how much the two populations overlapped. It does not provide the length distribution of the real benchmark, the intent distribution of the A/B population, or per-query offline results that would let us map the Cat@10 gain specifically onto the queries eligible for the experiment.
So I would not say that the offline benchmark and online population were misaligned in every respect. I would say something narrower: their construction rules were demonstrably different, and the degree of alignment between them was not established.
There is another boundary worth preserving. The paper describes the A/B comparator as the “baseline model.” The strongest reading is that this refers to the random-negative baseline configuration from the experimental setup. The paper does not explicitly establish that this comparator was IKEA’s then-live production search system before the experiment. I would not widen the claim beyond what the source gives us.
What the A/B Test Actually Established
The online result is also narrower than it may first appear. The paper reports no statistically significant difference between HNM and the baseline on click-through rate, add-to-cart rate, or search-interaction rate, with p > 0.05.
That means the reported two-week test did not detect a statistically significant difference on those measures. It does not mean the models were equivalent. It does not prove that HNM had no effect. It does not establish that users noticed no improvement, that category accuracy was irrelevant, or that the offline gain disappeared once the model entered production.
The public record does not provide the A/B sample size, eligible exposure volume, arm-level metric values, effect estimates, confidence intervals, exact p-values, minimum detectable effect, power calculation, or the full metric definitions and denominators. Without those details, I cannot tell whether the underlying effect was slightly positive, slightly negative, negligible, or simply too small for the reported experiment to distinguish.
IKEA does offer one account of that limitation. The paper states that restricting the test to long-tail queries limited statistical power. That is a plausible direction, but it is unquantified. Without sample size, outcome variance, or a minimum detectable effect, the statement cannot tell us how much sensitivity was lost, or whether reduced power is what produced the result.
This is why I think the common shorthand—”offline said yes, online said no”—is too strong. The offline side gives us a bounded metric improvement without a reported significance test. The online side gives us a non-significant result without the effect estimates or intervals needed to characterize the size of the difference.
The tension is real, but it is a tension between two incomplete readings rather than two fully measured outcomes pointing cleanly in opposite directions.
And the most ordinary explanation must remain available: HNM may simply have produced little commercially meaningful change on the engagement measures IKEA tested. The public evidence does not allow the more interesting analytical possibilities to crowd that possibility out.
How IKEA Interpreted the Online Result
After reporting the non-significant A/B result, the paper turns to user behaviour for an explanation. That explanation has two parts, and the paper presents them together: it states that its analysis of user search behaviour explains the result, citing both the 44.7% of queries it describes as broad category searches, where the baseline already performed well, and the finding that 67% of promoted popular searches had zero-click rates above 50%.
Each half needs separate handling.
Take the zero-click figure first. The abstract states that 67% of “popular searches” had zero-click rates above 50%, while the discussion refers to 67% of “promoted popular searches.” Neither set is defined in the public paper. The statistic therefore has a very specific meaning: 67% of an undefined set of query terms had zero-click rates above a 50% threshold.
It does not mean that 67% of searches, sessions, users, or traffic were zero-click.
The discussion then moves from that term-level statistic to a session-level premise. It reasons that when the majority of sessions end without clicks regardless of ranking quality, retrieval improvements have limited room to influence engagement metrics. The abstract makes a similar move, describing a substantial proportion of sessions as ending without product engagement regardless of result ranking. A statistic about query terms does not establish that session-level majority, and “regardless of ranking quality” is asserted rather than shown.
The category half carries a different evidentiary issue. The 44.7% figure was introduced earlier in the paper as a share of unique query strings; in the explanation it becomes 44.7% of queries. More significantly, the behaviour it describes is the behaviour the paper illustrates with single words such as “desk,” “bookshelf,” and “sofa”—strings that fall below the three-word threshold the experiment itself required. I cannot say that such queries were absent from the A/B population, because the paper does not disclose its composition. But the paper’s own category-only examples are below the three-word eligibility threshold, while the study does not report the length distribution of that query class or its representation in the A/B population.
This move is analytically important because it is not an interpretation I am imposing on IKEA from outside. The transition occurs inside the source itself. The researchers encountered an inconclusive online result and then used other behavioural observations to make sense of it.
The difficulty is that the public evidence does not establish the connection between those populations. We do not know how the “popular” or “promoted popular” query set was defined, whether it came from the same market and period, or how much it overlapped with the at-least-three-word A/B population.
Zero-click behaviour is also ambiguous. A shopper may not click because the result page already gave enough information, because the results were poor, because the shopper reformulated the query, because they were browsing passively, because they were interrupted, or for reasons the available signals cannot identify. Research outside IKEA shows that useful or satisfied non-click behaviour can exist, but much of the strongest evidence comes from informational web search, where the result page itself can sometimes answer the need—weather, stock quotes, local details, definitions. That mechanism cannot simply be transferred to furniture shopping.
I therefore see zero-click here less as an answer than as an observability problem. A missing click hides several possible states.
IKEA’s proposed next step points in that direction. The paper suggests richer future signals such as scroll depth, wishlist additions, filter and sort interactions, and query reformulation. Those are useful possibilities, but they remain proposals. The public record does not establish that IKEA later retained, rolled back, expanded, retested, or operationally recalibrated the system around those signals.
Where Behavioural Representation Shifted — and Where It Remains Unclear
At this point, I think the IKEA case becomes easier to read if I separate two different conditions: places where the evidence shows that behavioural representation changed, and places where the relationship between stages simply was not established.
Where the Representation Demonstrably Changed
The clearest shift appears between the broader production-query distribution and the 100-query real benchmark. Category-only queries represented 44.7% of the unique strings in the 28-day production-log analysis, yet the real benchmark was exhaustively divided among single-attribute, multi-attribute, and product-name queries. It contained no category-only stratum. The benchmark used authentic user queries, but its construction did not reproduce the stated production-query mix.
A second difference appears between the synthetic and real evaluation sets. Synthetic benchmark queries corresponded to an average of 1.7 relevant product categories, while real benchmark queries corresponded to 12.5. That matters because Category Accuracy@K depends partly on how many categories can count as relevant. The paper does compare the two directly, noting that Cat@50 is substantially higher on real queries than on synthetic ones and reading that as evidence that the models retrieve relevant categories but rank them lower when intent is broad.
That reading may well be right, but the comparison runs across two benchmarks whose relevant-category breadth differs by roughly seven times, so the absolute values do not represent exactly the same evaluation difficulty. This does not invalidate HNM-versus-baseline comparisons within the same benchmark; it does mean that the metric’s meaning changes when the underlying relevant-category breadth changes.
The third visible shift is the one that occurs when the real benchmark gives way to the A/B test. Offline queries were selected by query type. Online eligibility was selected by query length. The construction rule changed again. The magnitude of the difference is unknown, but the structural change itself is visible in the study design.
Where Alignment Remains Unknown
Other relationships are not demonstrably mismatched; they are simply not established in the public record.
We do not know whether the Cat@10 improvement that drove HNM selection occurred specifically among queries of at least three words—the population later served in the A/B test. The paper does not provide per-length or per-query offline results.
We also do not know whether the long-tail A/B population substantially overlapped the later “popular” or “promoted popular” query set used for the zero-click interpretation. The populations may overlap. The paper does not show us that they do.
And we do not know how improved category accuracy was expected to map onto click-through, add-to-cart, or search-interaction rate. Those measures are all legitimate, but they represent different constructs. The study selected HNM because category accuracy improved, then evaluated live behaviour using downstream engagement signals without publicly establishing the relationship between the two.
Not established is not the same as disproven.
That distinction changes my reading of the case. I do not see evidence that every stage was badly designed or that the chain was fundamentally broken. I see a sequence in which authentic evidence remained present while the slice of behaviour, the selection rule, or the success construct changed at several boundaries—and in which some later relationships were left unverified.
This is also why I would resist turning IKEA into an argument against offline search evaluation. A 2023 Amazon study tested 36 offline ranking metrics against the outcomes of live product-ranking experiments and found that the strongest of them agreed directionally with online business metrics in up to 97% of comparisons. The agreement was not uniform across the metrics tested, which is the useful part. Offline evaluation is not inherently unreliable; metric choice and the relationship between the offline measure and online outcome matter to whether the two track each other. The important question is therefore whether the offline and online stages are evaluating sufficiently comparable behaviour and sufficiently related outcomes.
That is the broader warning sign I take from IKEA. A business can have technically valid evidence at each stage and still risk misinterpreting its digital signals if the population, behavioural proxy, or success construct changes between stages without that change being explicitly tested.
What Search Evaluation Needs to Preserve
I do not read the IKEA case as evidence that hard-negative mining failed. I do not read it as evidence that category accuracy was the wrong metric, that click-based metrics were wrong, or that offline evaluation cannot predict online behaviour.
The public record supports a more specific conclusion.
IKEA’s evaluation chain used real catalogue data, authentic production queries, real users, and observed interaction behaviour. Yet authenticity alone did not guarantee continuity. The production-query mix, the real offline benchmark, the long-tail A/B population, and the later zero-click interpretation were not all constructed in the same way, and the public study does not establish all of the mappings between them.
That means the central lesson is not that real data failed. It is that real data and representative data are different properties.
For search evaluation, I think the practical implication is to test the transitions as carefully as the individual metrics. Which users or queries does this benchmark represent? What behavioural assumption is built into the metric we are optimizing? Does the population that improved offline match the population being tested online? Does the online KPI measure the kind of user value the offline metric was intended to improve? If we interpret the result using another behavioural signal, are we still looking at the same population?
None of those questions guarantees a positive experiment. A carefully aligned system can still produce little or no commercially meaningful improvement. HNM may simply have had a small effect on the engagement outcomes IKEA measured.
But if the mappings are not established, the meaning of the result becomes harder to interpret. Each signal may be authentic on its own while the decision chain quietly changes what that signal represents.
That is what I think IKEA’s case reveals most clearly: search evaluation does not only need valid evidence at each stage. It needs continuity in what the evidence is being asked to stand for.


